
2021 Travel Advisor Demographic Report
Host Agency Reviews’ annual travel advisor survey casts a wide net to profile many types of travel advisors—independently-accredited advisors, travel advisor employees, hosted advisors, and franchise-owners. In fact, we just closed our 2022 survey and will begin crunching the new data soon! In the meantime, I want to share with you the results of the 2021 survey.
So far, the results from our 2021 survey have afforded us the opportunity to look at COVID’s impact on advisors, who’s entering the industry, and the latest trends in travel advisor income and fees.
This particular report, our demographic report, offers insights on the travel advisor community—who you are and how you operate your businesses.
Here’s a look at the different types of advisors this report will profile:

Where we had enough data, we looked at demographic information by segment. If you’re a franchisee or employee, you can see previous demographic data here and take our survey so our next reports have sufficient data!
Read on to learn more about the different trends among each category of advisors!
Who Is the 2021 Travel Advisor? [Infographic]
The infographic offers an outline of what our full report will cover!
What Type of Travel Agents Took Our Survey?
1098 travel advisors are included in our demographic report. Below the graph indicates the distribution from each of the four travel agent categories (plus combinations):

No surprise here: The majority of travel agents who took our survey were hosted, 69%. However, we received a strong response from independent, employed, and franchisee agents as well.
Median Age by Travel Advisor Category
The median age among all our respondents was 61 years. Below you can read how median age varies by travel advisor category:

Independent advisors reported the highest median age of 58, with franchise owners close behind (at 57). However, there was not a significant difference in median ages between segments. Notably, the median age dropped in all advisor segments with the exception of hosted advisors (hosted advisor median age increased by one year when compared to last year).
A GENERATIONAL BREAKDOWN
The generational breakdown offers a clearer picture of age diversity within the industry. In 2020, Boomers (42%) and Gen Xers (42%) had overwhelming representation in the travel agent industry.
When looking at the industry overall (every category of travel agents) here’s the breakdown:

There was a four-point decrease among advisors who reported they were Baby Boomers or Silent Generation. Millennials and Gen Xers saw a slight increase (one point and four points respectively.)This indicates that advisors are skewing slightly younger than compared to the previous year. This trend may indicate more movement toward retirement among the industry.
Below we’ll take a look at the different travel agent categories and their respective generational breakdown:
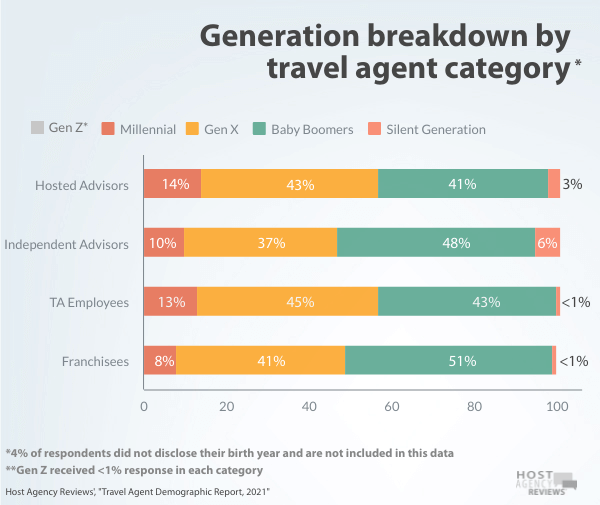
As in prior years, Baby Boomers and Gen Xers comprised the lion share of each travel agent category.
With exception of hosted advisors, the percentage of Boomers decreased in three advisor categories —independent advisors decreased by 6 points; employees by 10 points; and franchisees by nine points. The silent generation also decreased in every category as well, suggesting that advisors are skewing slightly younger than in 2019.
This could be due to the fact that the COVID-19 pandemic prompted a greater likelihood to retire from the industry.
Race & Ethnicity by Travel Agent Categories
Nearly three-quarters (74%) of advisors reported their race/ethnicity as white/Caucasian. This is a lower percentage than last year when 79% reported the same.
Compared to last year, a higher percentage of advisors identified as Black/African American, 13% compared to 10% last year. Those identifying at multi-racial remained at 4%, and the percent of advisors who identified as Hispanic/Latinx/Spanish increased one point in 2021.
The graph below shows the entire breakdown of hosted and independent advisors racially identified in 2021: 1
The graph below illustrates how racial/ethnic backgrounds varied among hosted and independent advisors.
While independently-accredited advisors had a higher percentage of non-white respondents than other travel advisor categories, the percentage of this racial/ethnic category increased 4 points from last year, when independent advisors were by far the most diverse travel advisor category.
Every other advisor category had a lower response rate among white/caucasian advisors compared to last year, with employees and franchisees seeing steeper declines (19 points and 9 points respectively).
Gender Breakdown Among Travel Agents
80% of travel advisors identified as women.
Among travel advisors that disclosed their gender 2, 80% identified as women (4 points lower than last year). 20% identified as men, and <1% identified as non-binary.
Below, the graph shows the gender distribution among the four different advisor categories:

While women represented the majority in every category, they had the lowest representation among franchisees, where 71% identified as women. Employees had the highest proportion of women, 90%.
However, the percentage of women was lower in every category compared to 2020. While we didn't have the opportunity to profile advisors who left the workforce, specifically, this aligns with data indicating that women were more likely to leave the workforce during the ongoing pandemic.
The decrease was most significant among travel agent employees and franchisees, which experienced a seven-point and 11-point drop respectively.
Experience Levels of Travel Agents
The median experience for all travel agents was 7 years. (This is one year less than last year.) This offers a baseline to compare median experience among the different categories below:
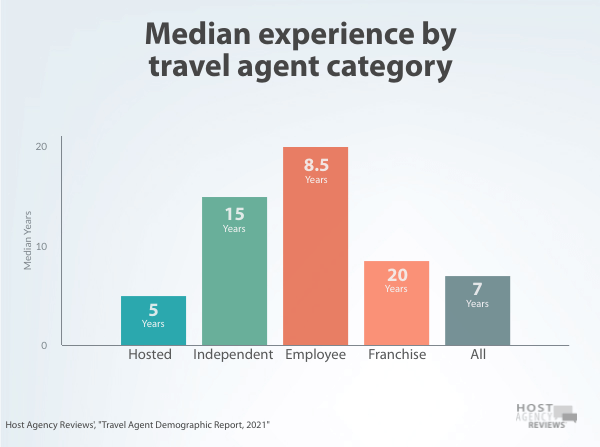
Independent advisors reported the same median experience as the prior year, 15 years. Every other category experienced a dip in median experience reported—a one-year drop for hosted advisors, two years for franchisees, and a four-and-a-half-year drop for employees.
While travel agent employees registered the largest drop in median experience, far and beyond they remain the most experienced category registering a 20 median experience.
Travel Agent Education
Bachelor’s degree received the highest response rate (36%) when asked, What's the highest level of schooling you've finished? 19% reported earning a master’s degree, and 19% reported some college but no degree.
Below you can see the complete breakdown of educational attainment among advisors:

With COVID upending advisor income in 2020, HAR did not look at correlations between education levels. However, past surveys have never indicated any income advantage in correlation with specific formal educational attainment. Rather, data has indicated that industry-specific certifications and industry engagement have a stronger impact on income potential, which we will explore below!
Read more about travel agent education and training opportunities.
Industry Engagement
In order to get a pulse on industry engagement, we like to look at what percentage of travel agents have received travel certifications, and how many are members of travel-specific organizations. In 2020 there was an increase in engagement among all advisors when in terms of association membership and attaining industry certification.
Overall, 77% of travel agents had at least one travel-specific certification in 2020. This marks a significant 8-point increase from the prior year. However, some categories of agents were more likely to be certified.
Here’s how certification attainment looked among the different travel agent categories:

Franchisees were most likely to report having 1+ certification at 71%. This is a higher rate compared to independent advisors, which was the top-reporting category last year.
What were the most common travel certifications? Across all travel advisor categories, the top three certifications were:
- Destination/Vendor Specialist: 63%
- ACC (through CLIA): 21%
- CTA (through The Travel Institute): 19%
Read more on travel agent certification opportunities.
TRAVEL AGENT ASSOCIATION MEMBERSHIP
Overall, 81% of travel agents were members of at least one travel association. Below is a breakdown of different travel agent categories and what percent were association members:

Different categories of advisors gravitated toward different associations. Here’s a list of the top 3 associations by advisor category 3:

Each category reported ASTA as the top travel association. This demonstrates that different organizations attract different agency models.
Home-Based or Storefront Travel Agencies?
89% of advisors across categories were home-based and 11% were storefront advisors. 4. But how does it break down among the different categories? Let’s take a look:
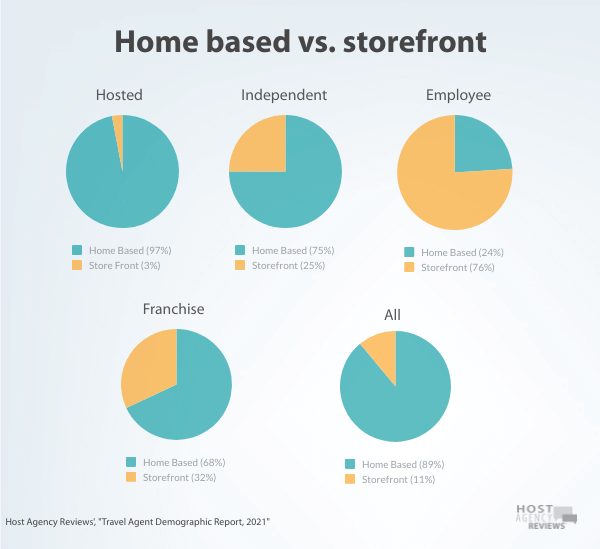
Registering at 96%, hosted advisors were by and far the most likely to operate their agencies from home. Independent advisors and franchisees were also much more likely to operate home-based agencies (75% and 68% respectively).
Where Are Travel Advisors Located?
Travel agents live all over the place! When looking at the national distribution of all travel agents, the top five regions of residence were:
- Southeast: 22%
- Southwest & Mid-Atlantic (both #2): 13%
- Midwest & Pacific Coast (both #4): 11%
(You can find the entire breakdown in the infographic above.)
Were different categories of agents more likely to congregate in different regions? Let’s take a look at the top regions of residence by travel agent category:

The Southeast received the highest response rate overall and registered the highest concentration of advisors for most travel advisor categories. The exception to this is travel advisor employees, who were primarily located in the Midwest.
Do Travel Agencies Have Independent Contractors & Employees?
25% of respondents reported having independent contractors (ICs) and/or employees in 2020 before the pandemic outbreak.
25% of respondents reported having independent contractors (ICs) and/or employees in 2020 before the pandemic outbreak. The majority of agencies downsized their agencies during the pandemic. Of those that reported having employees, 71% had to downsize, while 34% of agencies with ICs reduced their IC volume.
Independent agents were most likely to have employees and/or ICs (54%), followed by franchisees (48%), and hosted agents (17%).
Here’s how different categories responded when asked if they had independent contractors (ICs), employees, or both:

Is Selling Travel the Primary Income for Travel Agents?
When looking at all travel agents, 55% reported that selling travel was their primary source of income before COVID.
Of advisors who sold travel as a primary source of income before COVID, the vast majority, 69%, reported that selling travel continued to be their primary source of income during the pandemic as well.
Among the 31% who stopped selling as a primary source of income, 78% plan to return to selling as a primary source, 17% were not sure yet, and 6% reported they will not plan to return to selling as a primary source of income.

Here’s how the data varied among different categories:
Most categories reported that they sold travel as a primary income source at a lower rate, compared to 2019. The exception to this was franchisees, a category that received an eight-point bump in the percentage of advisors selling as a primary source of income.
HOURS WORKED:
61% of advisors overall sold travel full time (>30 hours/week) before COVID. This percentage dropped to 25 points after a pandemic was declared.
How did the FT/PT breakdown shake out across categories? See below:
Unsurprisingly, advisors typically earned more as they worked more hours, a trend that remained true during the pandemic. Check our latest income reports for hosted and independent agents.
Niche Across Travel Agent Categories
Among travel professionals who sold travel, 77% reported having a niche and 23% were generalists. 5
Below the chart indicates the top three niches among different segments for those who were not generalists:

Ocean cruises ranked as the top niche in every travel advisor category for 2020, making it the most popular niche. Luxury travel also ranked in the top three for every category as well.
Are you ready to establish a travel agent niche? HAR's here to help.
PRODUCTS SOLD
What did travel agents sell in 2020? The top three products sold overall were:
- All-Inclusive Resorts
- Cruises (Ocean)
- FIT
However, selling behaviors varied among travel agent categories. Here’s a look:

In 2020, all-inclusive resorts were the most-sold product among every travel advisor category, replacing oceans cruises as the top-selling product. This is likely due to pandemic cruise restrictions and because all-inclusive resorts were among the few travel options during the pandemic.
How do you find the right products for you? Read our Travel Agent Guide to Researching and Qualifying Suppliers.
Job Satisfaction Among Travel Advisors
Income Satisfaction
Despite the pandemic, the majority of advisors, 63%, reported that they felt fairly compensated.
Below the graph offers a look at the attitudes among different categories for 2020:

Registering 66%, franchisees and hosted advisors were the most satisfied with their compensation, with independent advisors and employees replying less favorably (55% and 58%, respectively).
Employees were the only category to express less satisfaction with their compensation in 2020 compared to 2019. Every other category responded at higher rates they felt fairly compensated.
Despite a majority of travel advisors reporting satisfaction with income levels, these rates have dropped significantly—10 points— since 2018, before the pandemic. Below the graph indicates how satisfaction with compensation shifted from pre-pandemic times to 2020:

Job Satisfaction
How happy and satisfied were travel agents with their choice of career? Here’s a breakdown by category:

2020 career satisfaction levels are on par with 2019 responses across categories. When considering two top responses to the question, “How satisfied/happy are you with your travel agent career?” employees responded most enthusiastically when looking at the top two responses (Super happy and satisfied, and Happy and satisfied.)
Would they become travel agents if they had a chance to choose again? Here’s what they had to say by category:

In every category, the overwhelming majority of travel advisors reported they’d choose a travel agent career again. In fact, every category responded they’d make the choice to become a travel advisor again at a higher rate than in 2019. Hosted advisors reported a four-point increase, independent advisors and employees registered a one-point increase, and franchisees saw a 13-point increase when compared to last year’s survey.
Franchisees were not only the least satisfied with income, but they were also the least likely to become a travel agent again.
Travel agent employees were less likely to become a travel agent again (compared to hosted and independent agents), despite reporting the highest rate of satisfaction.
Data Is the Gift that Keeps on Giving . . . Stay Tuned
Um. Wow. That was pretty thrilling. If you're as excited by this data as the HAR crew, then you're definitely in the right industry!!!! We conducted our 2022 survey early this year, which means we'll be turning around to publish 2021 income and fee trends in no time at all!
Don't forget to sign up for HAR's free newsletter to get the next report right to your inbox!
A Huge THANK YOU
A colossal thank you to these travel organizations: American Society of Travel Advisors, Association of Black Travel Professionals, CCRA, Destination Wedding Honeymoon Specialist Association, Ensemble Travel Group, Gifted Travel Network, Nexion Travel Group, Outside Agents, Royal Caribbean Cruise Line, Travel Quest Network, Travel Leaders Network, Travel Pulse, and Travel Research Online.
Want to work with us on future surveys? Drop us a line: Stephanie [at] HostAgencyReviews.com
The Method to Our Madness
Overall, 1,098 advisors responded to our 2021 Travel Agent Survey. This report includes all respondents who chose to disclose demographic information.
THE NITTY GRITTY
We know some of you may be seriously loving our data and looking for a few more details on the process.
Here's an overview of how we arrived at our numbers:
- Data is pre-COVID. HAR’s survey was conducted between June 1st and July 31st of 2021, seeking information from 2020. For this reason, these numbers are not reflective of a post-COVID industry.
- We round to the nearest percent or dollar. What can I say? It's easier on the eyes when you're wading through so much data. (Sorry, decimal points. We still love you.)
Footnotes
- “Other” is an aggregate of write-ins, which included South Asian, African, Creole, and Cape Verdean, European, Eastern European, and undisclosed. Two categories registered below 1%, Native Hawaiian or Pacific Islander (.4%); and Middle Eastern/North African (.1%). ↩
- 2% of respondents chose not to disclose gender identity ↩
- Travel Agent employees were not asked if they belonged to an association ↩
- We asked employees if they were required to work from home, required to work in an office, or a combination of the two. This data is reflected in the graph ↩
- The question, “what is your PRIMARY specialty/niche?” was only asked to those who reported selling travel. 7% of advisors were non-sales agents and were not asked this question. They are not included in this data. ↩