
Who Is the 2020 Travel Agent? [+Infographic]
Reports from Host Agency Reviews’ 2020 Travel Agent Income Survey are steadily landing on our blog.
Here in part 3 of our findings, we’ll explore the dynamic demographic composition of the travel agents.
What makes this report unique? In this report, we’ll look at every kind of travel agent under the sun. Newbies and seasoned pros. Employees and independent contractors. Hosted agents and franchisees. Hobbyists and careerists. We’re casting a wide net!
Our 2020 survey responses enabled us to break down our data by different travel agent categories. Here we’ll offer a side-by-side comparison of travel agent demographics among four travel agent categories: hosted agents, independently accredited agents, franchisees, and employees. (Read on for our definitions)
A close examination of the travel agent industry will offer trends and insights on who they are, how they operate their travel businesses, what they’re selling, and more. It will also explore how issues of race, gender, age, regionality (and more) shake out in the travel industry.
(Psst! In depth reports like this one are only possible with high participation rates! Sign up below and make sure you're included in future surveys.)

Who Is the Travel Agent in 2020? [Infographic]
This infographic below provides you with a roadmap for the rest of this report! (But be sure to read our report for a full view of the data)
What Type of Travel Agents Took Our Survey?
771 travel agents are included in our demographic report. The report looks at four different travel agent categories, defined below:

Below the graph indicates the distribution from each of the four travel agent categories (plus combinations):
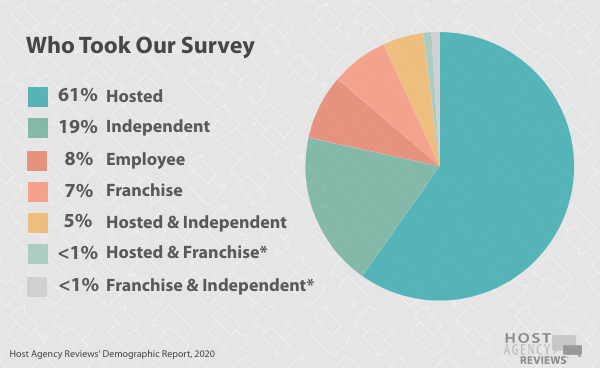
No surprise here: The majority of travel agents who took our survey were hosted, 61%. However, we received a strong response from independent, employed, and franchisee agents as well.
Median Age by Travel Agent Category
The median age among all our respondents was 55 years. Below you can read how it varies by travel agent category:
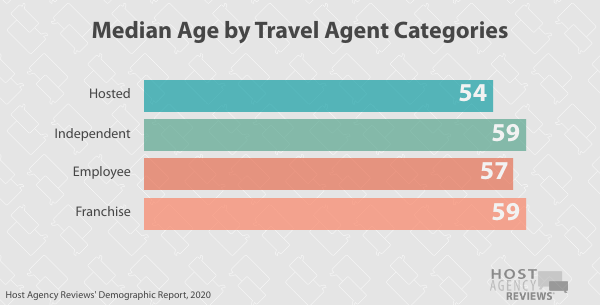
Franchisees and independent agents reported the highest median age (59), with hosted agents registering the youngest median age of the categories (54).
A GENERATIONAL BREAKDOWN
Looking at generational breakdown offers a clearer picture of age diversity within the industry. In 2019, Boomers (46%) and Gen Xers (38%) had overwhelming representation in the travel agent industry.
When looking at the industry overall (every category of travel agents) here’s the breakdown:

Below we’ll take a look at the different travel agent categories and their respective generational breakdown:

With one exception, Baby Boomers had the highest representation in each category. (The exception was hosted agents, where a higher percentage were GenXers.)
Race & Ethnicity by Travel Agent Categories
Overall, 79% of agents who took our survey were White/Caucasian, 10% identified as Black/African American, and 4% identified as multiracial. Two ethnic/racial categories registered a 2% response rate: Asian American, and Hispanic/Latinx/Spanish. 1Three categories registered below 1%: American Indian or Alaskan Native (.7%); Native Hawaiian or Pacific Islander (.5%); and Middle Eastern/North African (.1%).
When parsing out the different travel agent categories, here’s how racial/ethnic backgrounds varied among them:

White/Caucasian, Black/African American, and multiracial had the highest percentage of representation overall.
Overall, independent agents were one of the most diverse categories whereas travel agent employees were the most homogeneous: 93% of travel agent employees were Caucasian. Employees represented the fewest racial/ethnic groups compared to other categories (4 racial ethnic groups compared to 7 for all other travel agent categories).
Independent agents had the highest representation of Black/African American travel agents, 20%, compared to all other travel agent categories.
However, it's also important to note that the hosted agent channel is attracting a higher percentage of agents who identify as Black/African American or multi racial. In our New Hosted Travel Agent Report, 12% of new hosted agents identified as Black/African American (compared to 9% of hosted agents overall), and 9% identified as multi racial (compared to only 2% overall).
Gender Breakdown Among Travel Agents
Among travel agents overall, 84% of our respondents were women.
However, different categories of travel agents had different gender distributions. You can see it broken down below:

While women represented the majority in every category, they had strongest representation among travel agent employees, where 97% identified as women.
Independent agents had the lowest proportion of women, 79%.
Experience Levels of Travel Agents
The median experience for all travel agents was 8 years. This offers a baseline to compare median experience among the different categories below:

The median experience among travel agent employees was staggering: 24.5 years. This is substantially higher than any other travel agent category. Hosted agents reported the lowest median experience: 6 years.
Educational Attainment of Travel Agents
We asked agents about their education level. Most travel agents(36%) earned a bachelor’s degree. 21% earned a higher degree (master's or Ph.D.), 11% earned an associate degree, 8% attained a trade/vocational certificate, and 1% reported having a professional degree. 24% completed high school or finished some college.
Below you can see the complete breakdown of travel agents and the type of education they received:

The most common educational attainment among each travel agent category was a bachelor’s degree. The travel agent employee category had the highest concentration of high school graduates and associate degrees. Travel agent employee income was on par with hosted and independent agents (see more details in our income reports). This indicates that college education is not necessary for a successful career as a travel agent employee.
However, our surveys have never found a consistent income advantage by educational attainment. Selling travel doesn’t require a specific degree or certification. Over time, data has indicated that travel-specific certifications and industry engagement have a stronger influence on higher income potential, which you can read about in our income survey reports.
Read more about travel agent education and training opportunities.
Industry Engagement
In order to get a pulse on industry engagement, we like to look at what percentage of travel agents have received travel certifications, and how many are members to travel-specific organizations.
Industry engagement typically has more bearing over travel agent income than conventional education like a college degree.
TRAVEL AGENT CERTIFICATION
Overall, 69% of travel agents had at least one travel-specific certification. However, some categories of agents were more likely to be certified.
Here’s how certification attainment looked among the different travel agent categories:
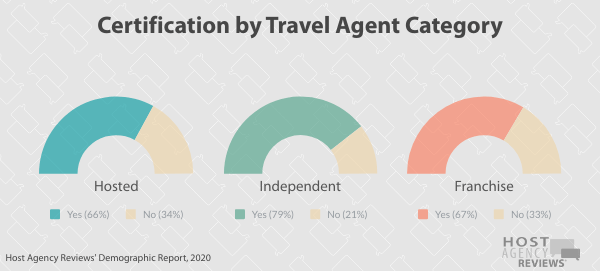
Independent travel agents were most likely to have a certification (79%), whereas hosted agents were least likely (66%).
What were the most common travel certifications? Across travel agent categories, Destination/Vendor Specialist certification was the top certificate agents earned. CTA was the second most common for hosted and independent agents (13% and 18% respectively), whereas employees were more likely to earn CTC (13%) and franchisees were more likely to earn an ACC (25%).
Read more on travel agent certification opportunities.
TRAVEL AGENT ASSOCIATION MEMBERSHIP
Overall, 77% of travel agents were members of at least one travel association. Below is a breakdown of different travel agent categories and what percent were association members:

Different categories of agents gravitated toward different associations. Here’s a list of the top 3 associations by agent category 2:

Each category reported a different top association. This demonstrates how different organizations attract different agency models.
Home-Based or Storefront Travel Agencies?
In total, 91% of hosted, independent and franchisees were home based 3 . But how does it break down among the different categories? Let’s take a look:
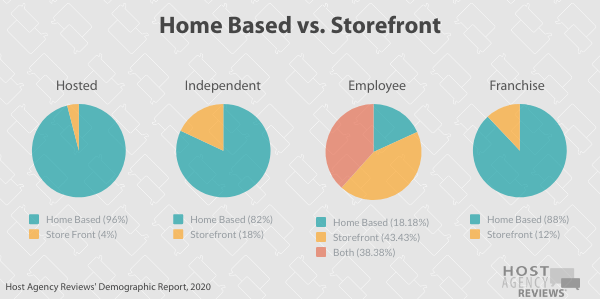
Hosted agents were most likely to be home based, followed by travel franchisees and independent agents, respectively.
Region
Travel agents live all over the place! When looking at the national distribution of all travel agents, the top three regions of residence were:

Were different categories of agents more likely to congregate in different regions? Let’s take a look at the top regions of residence by travel agent category:

When looking at individual travel agent categories, Southeast had the strongest representation compared to other regions. However, travel agent employees were most concentrated in the Midwest.
Independent Contractors & Employees?
32% of respondents reported having independent contractors (ICs) and/or employees in 2019. But some categories were more likely to take on travel agents.
Here’s how different categories responded when asked if they had independent contractors (ICs), employees, or both:

Independent agents were most likely to have employees and/or ICs (46%), followed by franchisees (38%), and hosted agents (29%). 4
Is Selling Travel the Primary Income for Travel Agents?
When looking at all travel agents, 64% reported that selling travel was their primary source of income.
Here’s how this varied among different categories:

Employees were most likely to sell travel as a primary source of income (98%), followed by independent (67%), and franchisees (62%). Hosted agents were least likely to sell as a primary source of income (59%).
We asked what percent of overall income was from selling travel to those who said selling travel was not a primary source. Among this segment, selling travel comprised 18% of total income on average.
However, this varied significantly among different categories of travel agents. 5 Below indicates the percentage of travel income in each category for those who do not sell travel as a primary income source 6:
Hosted: 16%
Independent: 29%
Franchisee: 24%
HOURS WORKED:
Typically, data for full-time compared to part-time agents mirrors the trends of primary income compared to non-primary income data. This report is no different. 64% of agents overall sold travel full time.
How did the FT/PT breakdown shake out across categories? See below:

Agents who worked full time earned exponentially more than those who worked part time. This is a trend that’s repeated throughout every category of travel agent. Check our latest income reports for hosted and independent agents.
Niche Across Travel Agent Categories
This year for the first time, we asked travel agents if they considered themselves generalists (book anything) or if they had a niche. Across all segments, only 23% reported having a niche, falling below generalists (41%) and those who were working toward a niche (36%).
Below, the chart illustrates niche trends by travel agent category:

Employees were most likely to be generalists (63%)
Below the chart indicates the top three niches among different segments for those who were not generalists:

It’s worth noting that 25% of TA employees reported their niche was “other.” This is an aggregate of write-ins for niche.
We did not include “other” on our niche chart since the category doesn’t accurately represent a type of travel. However, this indicates that employees casted a wider net when it came to different travel niches. 12% of franchisees also reported selling “other” products, which would rank it as a third-place tie with Family Travel.
Are you ready to establish a travel agent niche? HAR's here to help.
PRODUCTS SOLD
What did travel agents sell in 2019? The top three products sold were:
- Ocean Cruises: 31%
- All-Inclusives: 25%
- FITs: 16%
However, selling behaviors were varied among travel agent categories. Here’s a look:

With the exception of independent agents (who primarily sold all-inclusives) most travel agent categories reported ocean cruises as their top-selling product. Employees were the only ones who reported corporate products (airlines) as one of their top three products sold.
How do you find the right products for you? Read our Travel Agent Guide to Researching and Qualifying Suppliers.
Job Satisfaction
Overall, 61% of agents felt fairly compensated with their existing income level. However attitudes varied by travel agent category.
Below, the graph reveals agents’ attitudes toward their compensation level:
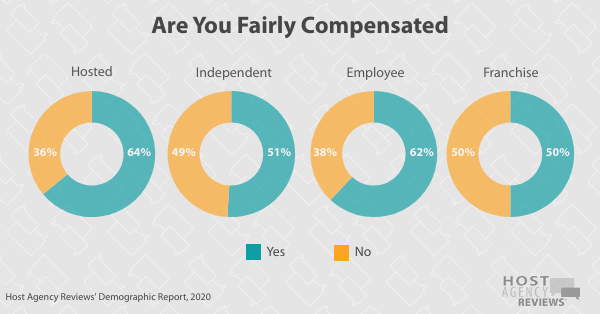
Franchisees and independent agents were the least satisfied with their compensation (50% and 51% respectively) whereas hosted and employed agents were the most satisfied (64% and 62% respectively).
How happy and satisfied were travel agents with their choice of career? Here’s a breakdown by category:

In general, travel agent employees were the most satisfied in 2019, and franchisees expressed the least amount of satisfaction.
Would they become travel agents if they had a chance to choose again? Here’s what they had to say:

In every category, the vast majority of travel agents reported they’d choose a travel agent career again.
Franchisees were not only the least satisfied with income, but they were also the least likely to become a travel agent again.
Travel agent employees were less likely to become a travel agent again (compared to hosted and independent agents), despite being reporting the highest rate of satisfaction.
A Huge THANK YOU
I'd like to credit our phenomenal participation rate to our t-rex suits and our shining personalities, but the fact of the matter is that in order to get this great data, we rely on industry partners who support our work and push the survey out to their networks. Who are these fabulous host agencies, franchises, and travel organizations?
A colossal thank you to these hosts and franchises: ASTA, Travel Leaders Network, Ensemble, Destination Wedding University, Gifted Travel Network, KHM Travel Group, Nexion Travel Group, Travel Planners International, Travel Quest Network, and Uniglobe Travel Center.
This data doesn’t just materialize in my brain. Far from it! Huge thanks to this year's data whisperer, Bridget Lee, who endured a barrage of Slack messages from me in the middle of the night. April Oliveira created all the snazzy images and infographics for all our survey reports this year. (Let’s face it, it’s the part that really gets your attention).
Steph Lee, HAR’s founder, is the brainchild of this whole survey project. Without Steph, you’d be by your lonesome without this leading industry data.
Want to work with us on upcoming surveys? Drop us a line: Stephanie [at] HostAgencyReviews.Com
Past Income Survey Results & Data
If you're still sticking around, you must really be invested in contributing to great industry data. Sign up below and never miss participating in a future report:
You’re not full of info? You want to gorge yourself on more great data? Sate your voracious curiosity and a look at HAR’s income survey archive (which includes results to every survey we’ve conducted since the beginning of HAR)!
The Method to Our Madness
Here’s the dealio: This report includes data from 771 travel agent survey respondents.
THE NITTY GRITTY
We know some of you may be seriously loving our data and looking for a few more details on the process.
1. 771 respondents met our criteria to be included in this report.
2. Income data is from 2019: HAR’s income survey was conducted in July and August of 2020. All respondents used their annual 2019 income numbers to complete our survey.
3. Sometimes we used the median amount when we calculate our data: What is a median? Median is the middle value of a dataset. For example, the median age of independent agents was 57 years. This means that 50% are older than 57 years, and 50% are younger. We also use it when looking at experience. The median is less impacted by outliers (compared to averages) and offers a more accurate picture of age and experience distribution.
4. We calculate income using averages: Average is the sum of a group of values divided by the number of values in the group. To calculate our income averages, we first remove extreme outliers (see #4).
5. In most cases, we round to the nearest percent or dollar. What can I say? It's easier on the eyes when you're wading through so much data. (Sorry, decimal points. We still love you.)
Footnotes
- “Other” is an aggregate of write-ins, which was comprised of Caribbean, American, light pigmentation, and undisclosed. ↩
- Travel Agent employees were not asked if they belonged to an association ↩
- We asked employees if they were required to work from home, required to work in an office, or a combination of the two. This data is reflected in the graph ↩
- Percentages represent a total among those who have ICs, employees or both. ↩
- Only one travel agent employee reported that selling travel was not their primary income. We did not have sufficient data to provide a reliable average ↩
- Employees is not included in the list below as we had insufficient data for employees that did not sell as primary income. ↩
