
Who Is the Hosted Travel Agent in 2019?
It's possible you might be stuffed to the gills with data from our 2019 Travel Agent Income Report (if not, head on over our data party!) But guess what? That was just the first course. Here, we have more great data for you to feast on—travel agent demographics, job satisfaction and challenges, business models, industry engagement and more!
Not enough data here for you? Check out HAR's entire archive of income reports and resources.
Here's a preliminary look at some of the data for our profile of hosted agents:
- 82% female
- Average experience was 7 years
- 52 was the average age
- 15% reported having ICs
- 62% earned (at least) one industry certification
- 50% worked full-time (30+ hours)
With diverse backgrounds and nearly as many agency models as there are agents, it's impossible to give singular picture of a "typical" hosted agent. But our article will give you a tour of this data, joining the puzzle pieces to offer a big-picture look at what people and what kind of agencies make up our vibrant industry.
The article will also hit on attributes of higher-income earning agencies. So if you're looking to see what (financially) successful agencies have in common, you're in the right place.
Who is the Hosted Travel Agent in 2019? The Big Picture
Below is a snazzy infographic to give you an idea of some of the data we'll be digging into.
Travel Agent Demographic Data
The demographic data is pretty much an identical twin to last year's data (and the year before). One thing we did differently this year, was to get real personal and ask each respondent their age (without the protection of generous age ranges). This way, we were able to look more closely at how life stages aligned with industry experience.
AGE:
In 2019, the average age of the hosted agent was 52. This is two years older than last year, when the average age was 50, but a slight decline from 2017, when the average age was 53.
race/ethnicity:
In 2019, 77% of agents who took the survey were white (a 2% increase from last year). 13% identified as Black/African American (2% less than last year), 3% identified as multi racial (1% more than last year), and 2% identified as Asian (same as last year).
TPOC (Travel Professionals of Color) Association is a great resource for any agent/supplier who is looking to reach and network with the minority tourism market.

GENDER:
82% of our respondents were women (compared to 79% last year). Despite their collective majority in 2019, women were subject to a significant gender income gap, with established agents earning 79 cents to the dollar of their male counterparts. 1 This is a 180º shift from last year when women reported earning 32% more than men.
Time investment, hours per booking, and agency model (storefront vs. home based) were equitable between the sexes.
Why the sea change in this income distribution? It's hard to say. Time investment, hours per booking, and agency model (storefront vs. home based) were equitable between the sexes. But here's three (data-driven) speculations as to why this income imbalance may exist:
- Men were more than twice as likely to report working 60+ hours/ week. Our data showed that agents who worked these long hours earned substantially more income than all other agents (52% more than agents who reported working 50-59 hours). See here for details.
- Men reported having 13 years of experience on average, compared to 10 years among women. Experience is one of several factors that had a correlation with higher income.
- Male-owned agencies reported servicing more clients than their female counterparts: 32% of men reported having more than 200 clients whereas only 15% of women reported the same.
Want to help women gain momentum in the upward climb into industry leadership positions? Check out WINit (Women in Travel).
Industry Experience
37% of agents who completed the survey were new to the industry (0-2 years experience). This is 11% lower than last year when 48% of surveyed agents were new. On average, hosted agents reported having 7 years of experience selling travel! Holy heck that is a lot of experience!
37% of agents who completed the survey were new to the industry (0-2 years experience). This is 11% lower than last year when 48% of surveyed agents were new.
Want to see specific data on both newbies and veteran agents? Follow this fork in the path to check out data on established agents. New agents, we're not ignoring you. We're working on profiling your segment specifically in a separate article soon!
Education LEVEL
We also asked agents about their education level, revealing how much and what type of education they completed. 34% of all hosted travel agents were college graduates. 19% had some college under their belt; a combined total of 22% attended trade/vocational school or received an associate's or professional degree. 19% earned a higher degree, and 6% received a high school education.
Our findings showed that education level had little impact on income earnings. Rather, income was more likely to be impacted by industry-specific engagement and education.
There's more where this came from. Sign up for our monthly newsletter to make sure you don't miss anything!
Industry Engagement
While education level had little bearing on travel agent income, industry engagement had a much greater impact. Here's a quick look at how many agents reported having certifications and association membership:

Travel Agent Certifications
There are travel agent certifications abound, but let's be honest, sometimes it's hard to know if it makes a difference. But our data shed a little light on how travel certifications influence income.
Agents had the chance to select from 12 different kind of certifications (if you want to see some examples of certifications included in the survey, check out this article). 62% of agents reported having at least one certification. The top 3 certifications agents earned were:
- ACC (Accredited Cruise Counselor, from CLIA)
- CTA (Certified Travel Associate, from the Travel Institute)
- MCC (Master Cruise Counselor, from CLIA)
At the end of the day, our data found that certification had little correlation to income, registering neither a positive nor negative impact.
Read here to find out more about travel agent certification options.
Travel agent association membership
Compared to certifications, a much smaller percentage of agents reported having a membership to a travel association. Only 32% of agents reported having membership to associations. 2
Among agents who reported membership with an association, 60% were attributed to ASTA (American Society of Travel Advisors) membership.
Unlike certification, association membership had a strong correlation to higher income: Those that reported belonging to an association earned 35% more than non-members. 3
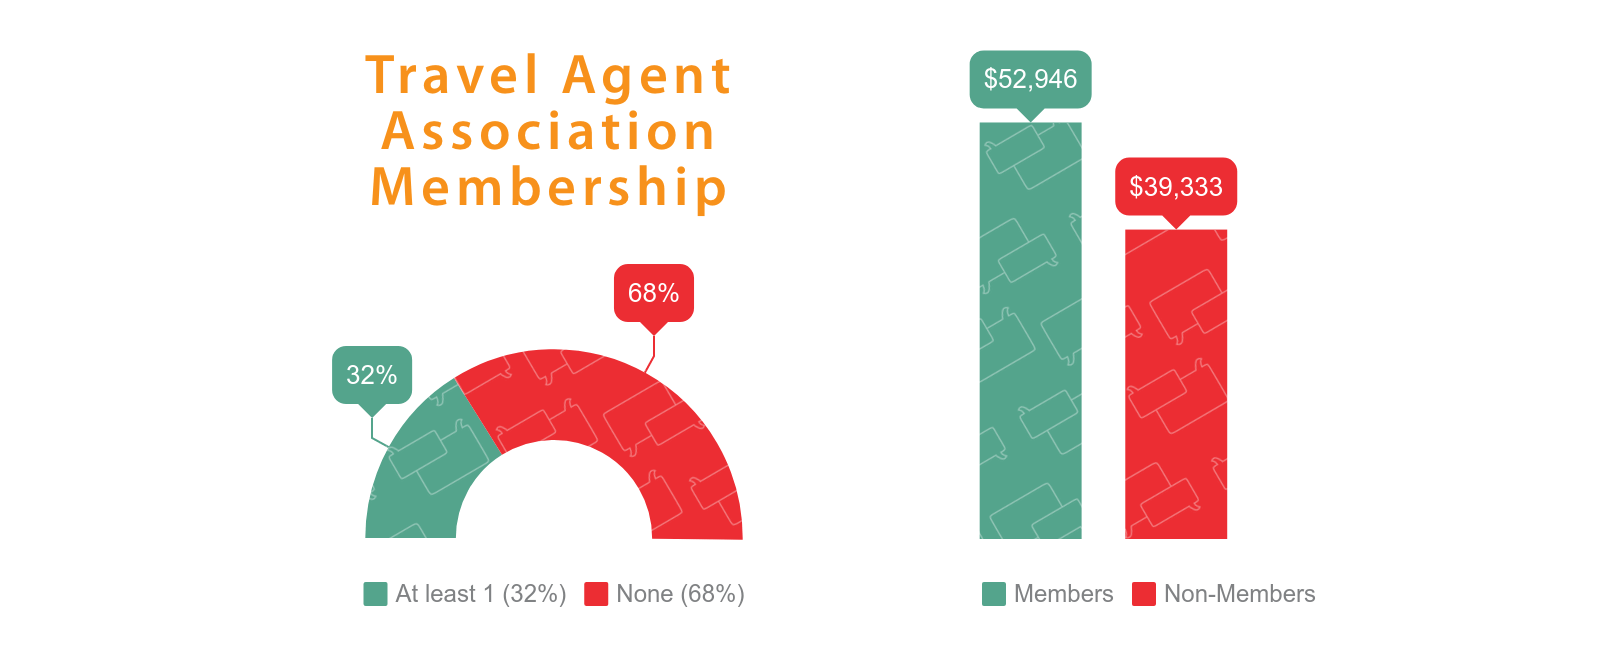
What was the most commonly-selected association? Among agents who reported membership with an association, 60% were attributed to ASTA (American Society of Travel Advisors) membership.
Business Basics
What makes a travel agency tick? This is one of our burning questions on the survey, and we asked a whoooooole lot about how agents run their business. (Thank you, dear agents for indulging us!)
Here's a look at how hosted agents run their business, day-to-day.
Business model
In a slight uptick from last year, 95% of the agents who responded to our survey were home based and the remaining 5% were storefront. 15% of agents reported having at least one IC and 5% of agents reported having at least one employee. Is it a coincidence that the number of storefront agents (44) is almost identical to the number of agents with employees (40)? I'll let you speculate :)
The survey showed that storefront agents also have 12 years of experience, 5 years more than the average home based agent.

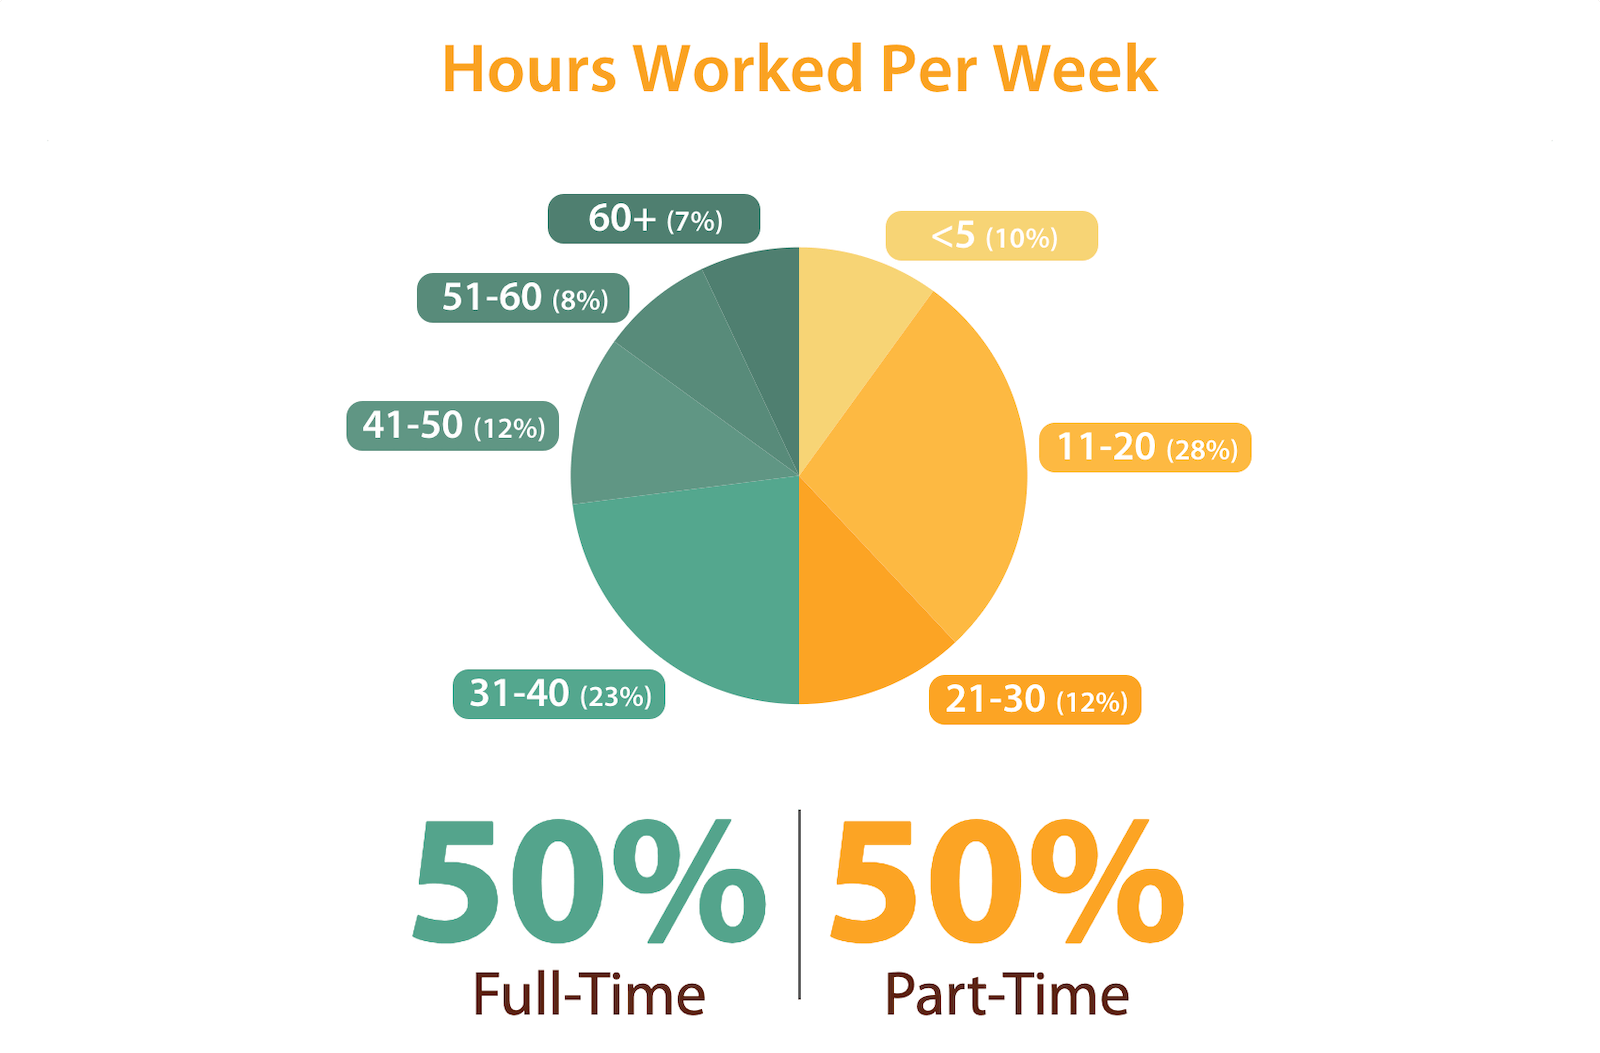
Time Investment
Okay, so exactly how many hours are these agents clocking? This year, 50% of all hosted agents reported working full time (30+ hours). This is the same as last year.
How did the number of hours worked shake out among our respondents? See below:
If you're curious to see how time investment impacted income potential, check this out!
Products sold
What do these agents sell? The top 3 travel products sold in 2019 were the EXACT same as 2018. Even the distribution among the top 3 products remained consistent to last year's results (with the exception of Tour Packages):
- Ocean Cruises: 42% (same as last year)
- All-Inclusives: 30% (same as last year)
- Tour Packages: 9% (6% lower than last year)
One notable shift from last year is that, due to a high volume of write-ins for FIT in 2018, we decided to include it as an option in 2019. It was a popular choice — 8% of agents reported FITs was the primary product they sold! This echoes the shift in travel trends toward clients seeking specialized, unique travel experiences.
Niche
The top 3 niches also remained the same in 2019 from the previous year, however ocean cruises bumped up to the top of the list after trailing family travel in 2018:
- Cruise, 27%
- Family Travel, 23%
- Destination Specialist, 12%
Last year, family travel was the most popular niche followed by cruise and destination specialist, respectively. Unfortunately, we're not able to do a side-by-side comparison to the response rate to last year: in 2018, agents were able to select multiple niches, whereas this year, they were only able to select their primary niche.

Niches with ≤2% response are not included in the infographic: 2% of agents reported their niche was adventure travel, and river cruise. ≤1% of agents identified their primary niche as corporate, accessible travel, other, all-inclusive, wellness, LGBT, and medical tourism.
Travel Agency Websites
Travel agent websites are always a hot topic in our 7 Day Setup Facebook support group for newer agents. How many agents have them? Which ones do they use?
Reporting at 83%, the majority of agents have a website (we sure hope so!). We were curious why 17% do not have a website, so we did a little digging: Among agents who reported not having a website, 31% were in their first year of selling travel. We get it. It takes time to set up a site. As for the rest of you, we'd love to know why you don't have a website! So if you're willing to in indulge my curiosity, hit me up with an email.
What are the travel agency website options out there? What are the pros/cons of each? Read this.
Online Booking Engines
The survey also looked into online booking engines, asking agents what online booking engine they use (if any), the volume of bookings they receive annually via that channel, and how much income it produced.
37% of hosted agents reported having a booking engine on their site for clients to book directly. However, the volume of bookings from these tools was nominal: 63% of agents reported making 0 bookings on from their online booking engine, and only 3 agents (1%) reported having more than 50 bookings annually.
Curious about the amount income earned from online booking engines? Check out this section of our Travel Agent Income Survey Report, 2019.
Job Satisfaction
When it comes to satisfaction with compensation, only 73% feel fairly compensated. Among the 27% who do not feel fairly compensated, the majority would like to give themselves an 11-25% raise . . . and, it may come as no surprise, but some agents want a bigger raise. Here's the deets:

But here's a silver lining (two actually):
- More agents—3% more to be exact—feel fairly compensated compared to last year.
- Despite the fact that 27% of agents feel underpaid, 95% of travel agents reported if they had a do-over, they'd become a travel agent again. That's pretty good, considering you could've decided to be a wardrobe consultant for Beyoncé instead (no, you cannot go back and change your answer, sorry).
95% of travel agents reported if they had a do-over, they'd become a travel agent again.
Just how happy are travel agents? Please forgive me if I start to sing "if you're happy and you know it." As a mom to a toddler, it comes to mind because travel agents are a happy bunch when it comes to their work life :)
- 37%: "Super Happy & Satisfied"
- 40%: "Happy & Satisfied"
- 21%: "Somewhat Happy & Satisfied"
- 3%: "Don't Ask, It's Depressing"
Okay, so there are slightly fewer "super happy" agents than last year (1% fewer, to be exact). But 2% more agents joined the "happy and satisfied camp," so there's balance in the universe, right?
As for the depressed agents? The exact same percentage expressed their sorrows on our survey. Why are these agents so bummed out? This is the perfect (albeit sad) segue into travel agent challenges:
Travel Agent Challenges
Okay look, it's not all sunshine and lollipops. Being a travel agent is hard, even thought it's rewarding (not to mention a great conversation-starter at a cocktail party).
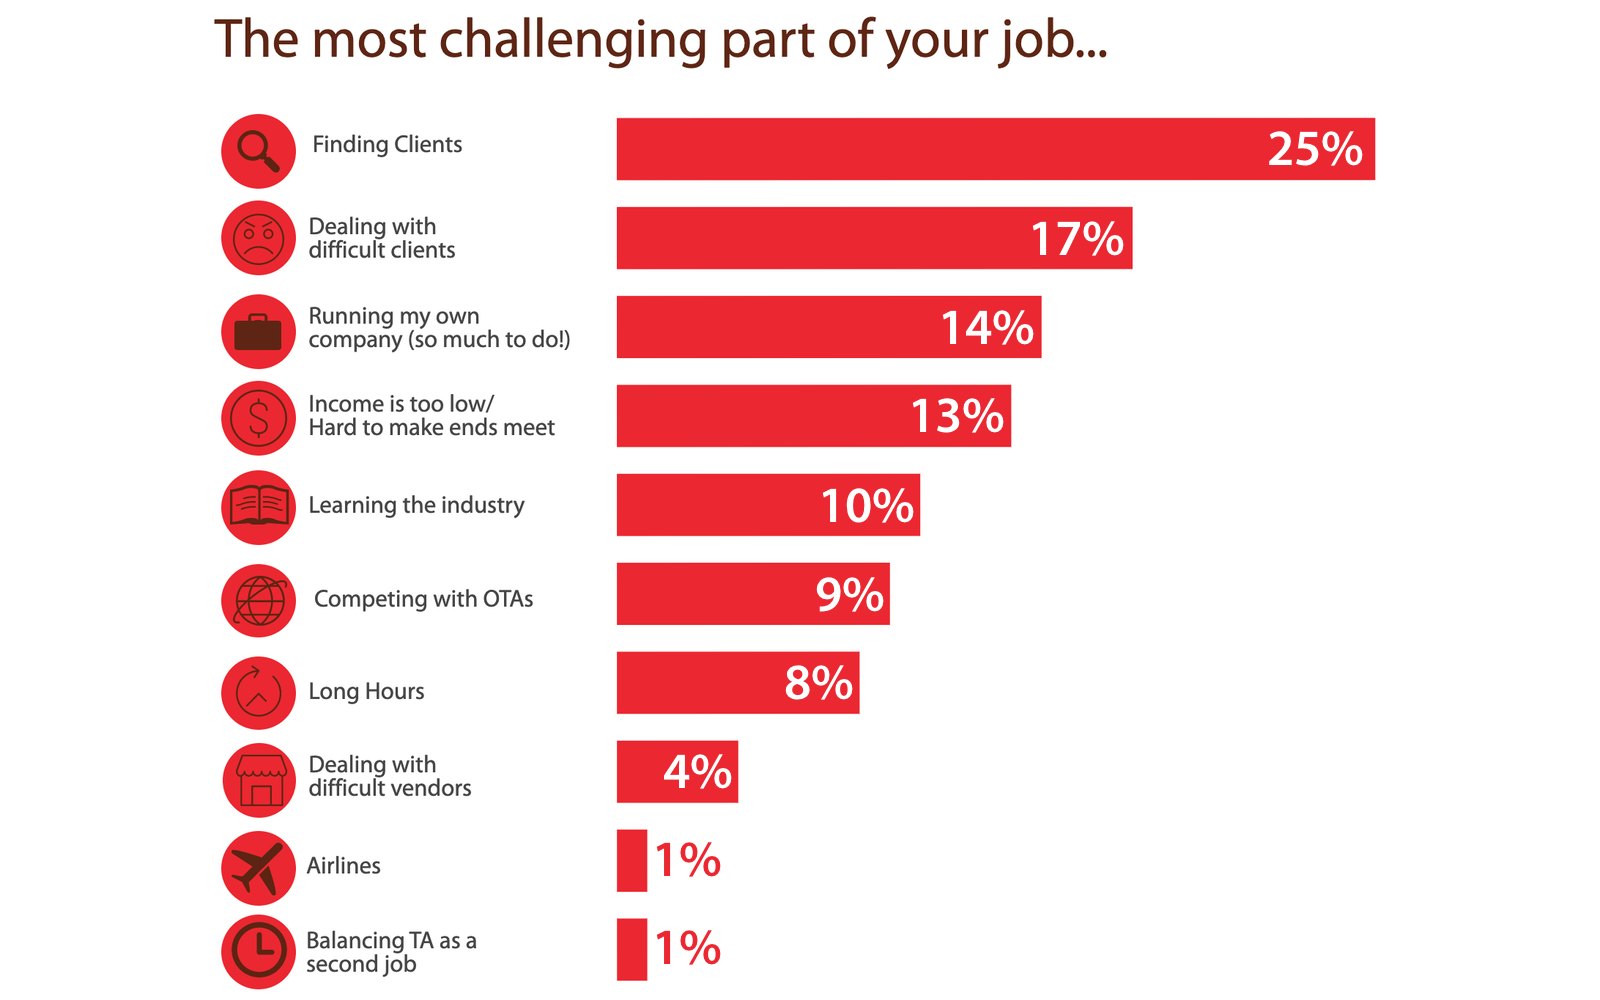
In 2019, "Finding Clients" remained the most popular grievance when agents were asked, "What is the most challenging part of your job?"
In 2019, "Finding Clients" remained the most popular grievance when agents were asked, "What is the most challenging part of your job?" BUT, while "finding clients" remains the biggest challenge, a much lower percentage selected that option compared to last year (25% in 2019 vs. 32% in 2018).
Travel Agent Rewards
At HAR we're a "Glass-Half-Full" kind of crew, so let's end it on a positive note, shall we? We also asked agents about the most rewarding aspect of the job. I am happy to say that 27% of agents reported, "I love everything about my job!"
We added a new category this year, "Making people's dreams come true," and 20% of agents reported that was their favorite part about their job.

Travel Agents Love John Denver. (Who Knew?!)
Okay, so YOU knew because you already read our 2019 Travel Agent Income Report. But it's worth repeating because love for John Denver was strong. 67% strong if you want to get picky about it.
Here's a different version of Leaving on a Jet Plane:
Data Is the Gift that Keeps on Giving . . . Stay Tuned
Um. Wow. That was pretty thrilling. If you're as excited by this data as the HAR crew, then you're definitely in the right industry!!!! We are cooking up other great information including a profile of agents new to the industry. So keep your ear on the rails for more data to come!
A Huge THANK YOU
In order to get this great data, we rely on industry partners who support our work and push the survey out to their networks. Who are these fabulous host agencies, franchises, and travel organizations?
A colossal thank you to these hosts and franchises: Cruise Planners—American Express, Dugan's Travel, KHM Travel Group, Nexion, Outside Agents, Travel Planners International, Travel Quest and our industry partners, Travel Research Online, Destination Weddings University, and Travel Weekly. (Want to join the fun with our future surveys? Drop us a line: hello [at] hostagencyreviews.com)
Past Income Survey Results & Data
Wow. Are you having an information hangover after this huge data party? No? You want more?! You animal, you. Take a look at income survey results from our previous years!
- "Travel Agent Income Report, 2019
- "Travel Agent Income Report, 2018
- "Which Travel Agent Specialties Generate the Most Income? (2018)"
- "Travel Agency Startup Costs and Earnings: What to Expect"
- "Who is the Hosted Agent in 2018?"
The Method to Our Madness
The travel agents we polled were primarily hosted agents. If this is old news to you, read on. If this is unfamiliar info, I highly recommend you check out this article, "What Is a Host Agency," which will give you a foundation on what HAR is all about.
Let's dive into the geeky nuts-and-bolts stuff about how we arrived at such a fabulous frenzy of travel agent data.
DATA DETAILS
Dr. Maga Gei visited again to help crunch numbers for our survey. We know some of you may be seriously loving our data and looking for a few more details on the process. For this article, it's relatively simple:
1. For this article, we tallied all hosted agents (881): We also included agents who responded they were both hosted and had their own accreditation number. If you were straight-up independent (have your own accreditation number and not hosted), we left you out. Not because we don't love you, but we didn't have enough data to put you in the spotlight this time around.
2. We round to the nearest percent: What can I say. It's easier on the eyes when you're wading through so much data. (Sorry, decimal points. We still love you.)
Footnotes
- Findings from Travel Agent Income Report, 2019, which profiled only established agents with 3+ years experience. ↩
- in the survey, the associations we included were: ASTA, ASTA-SBN, ARTA, ACTA, ATTA, CCRA, GBTA, WINit, TPOC, IGLTA, MAPTA, PTANA, and NACTA. Missing any of your faves? Let us know. ↩
- The data for this income comparison is for established agents only (3+ years experience). ↩
